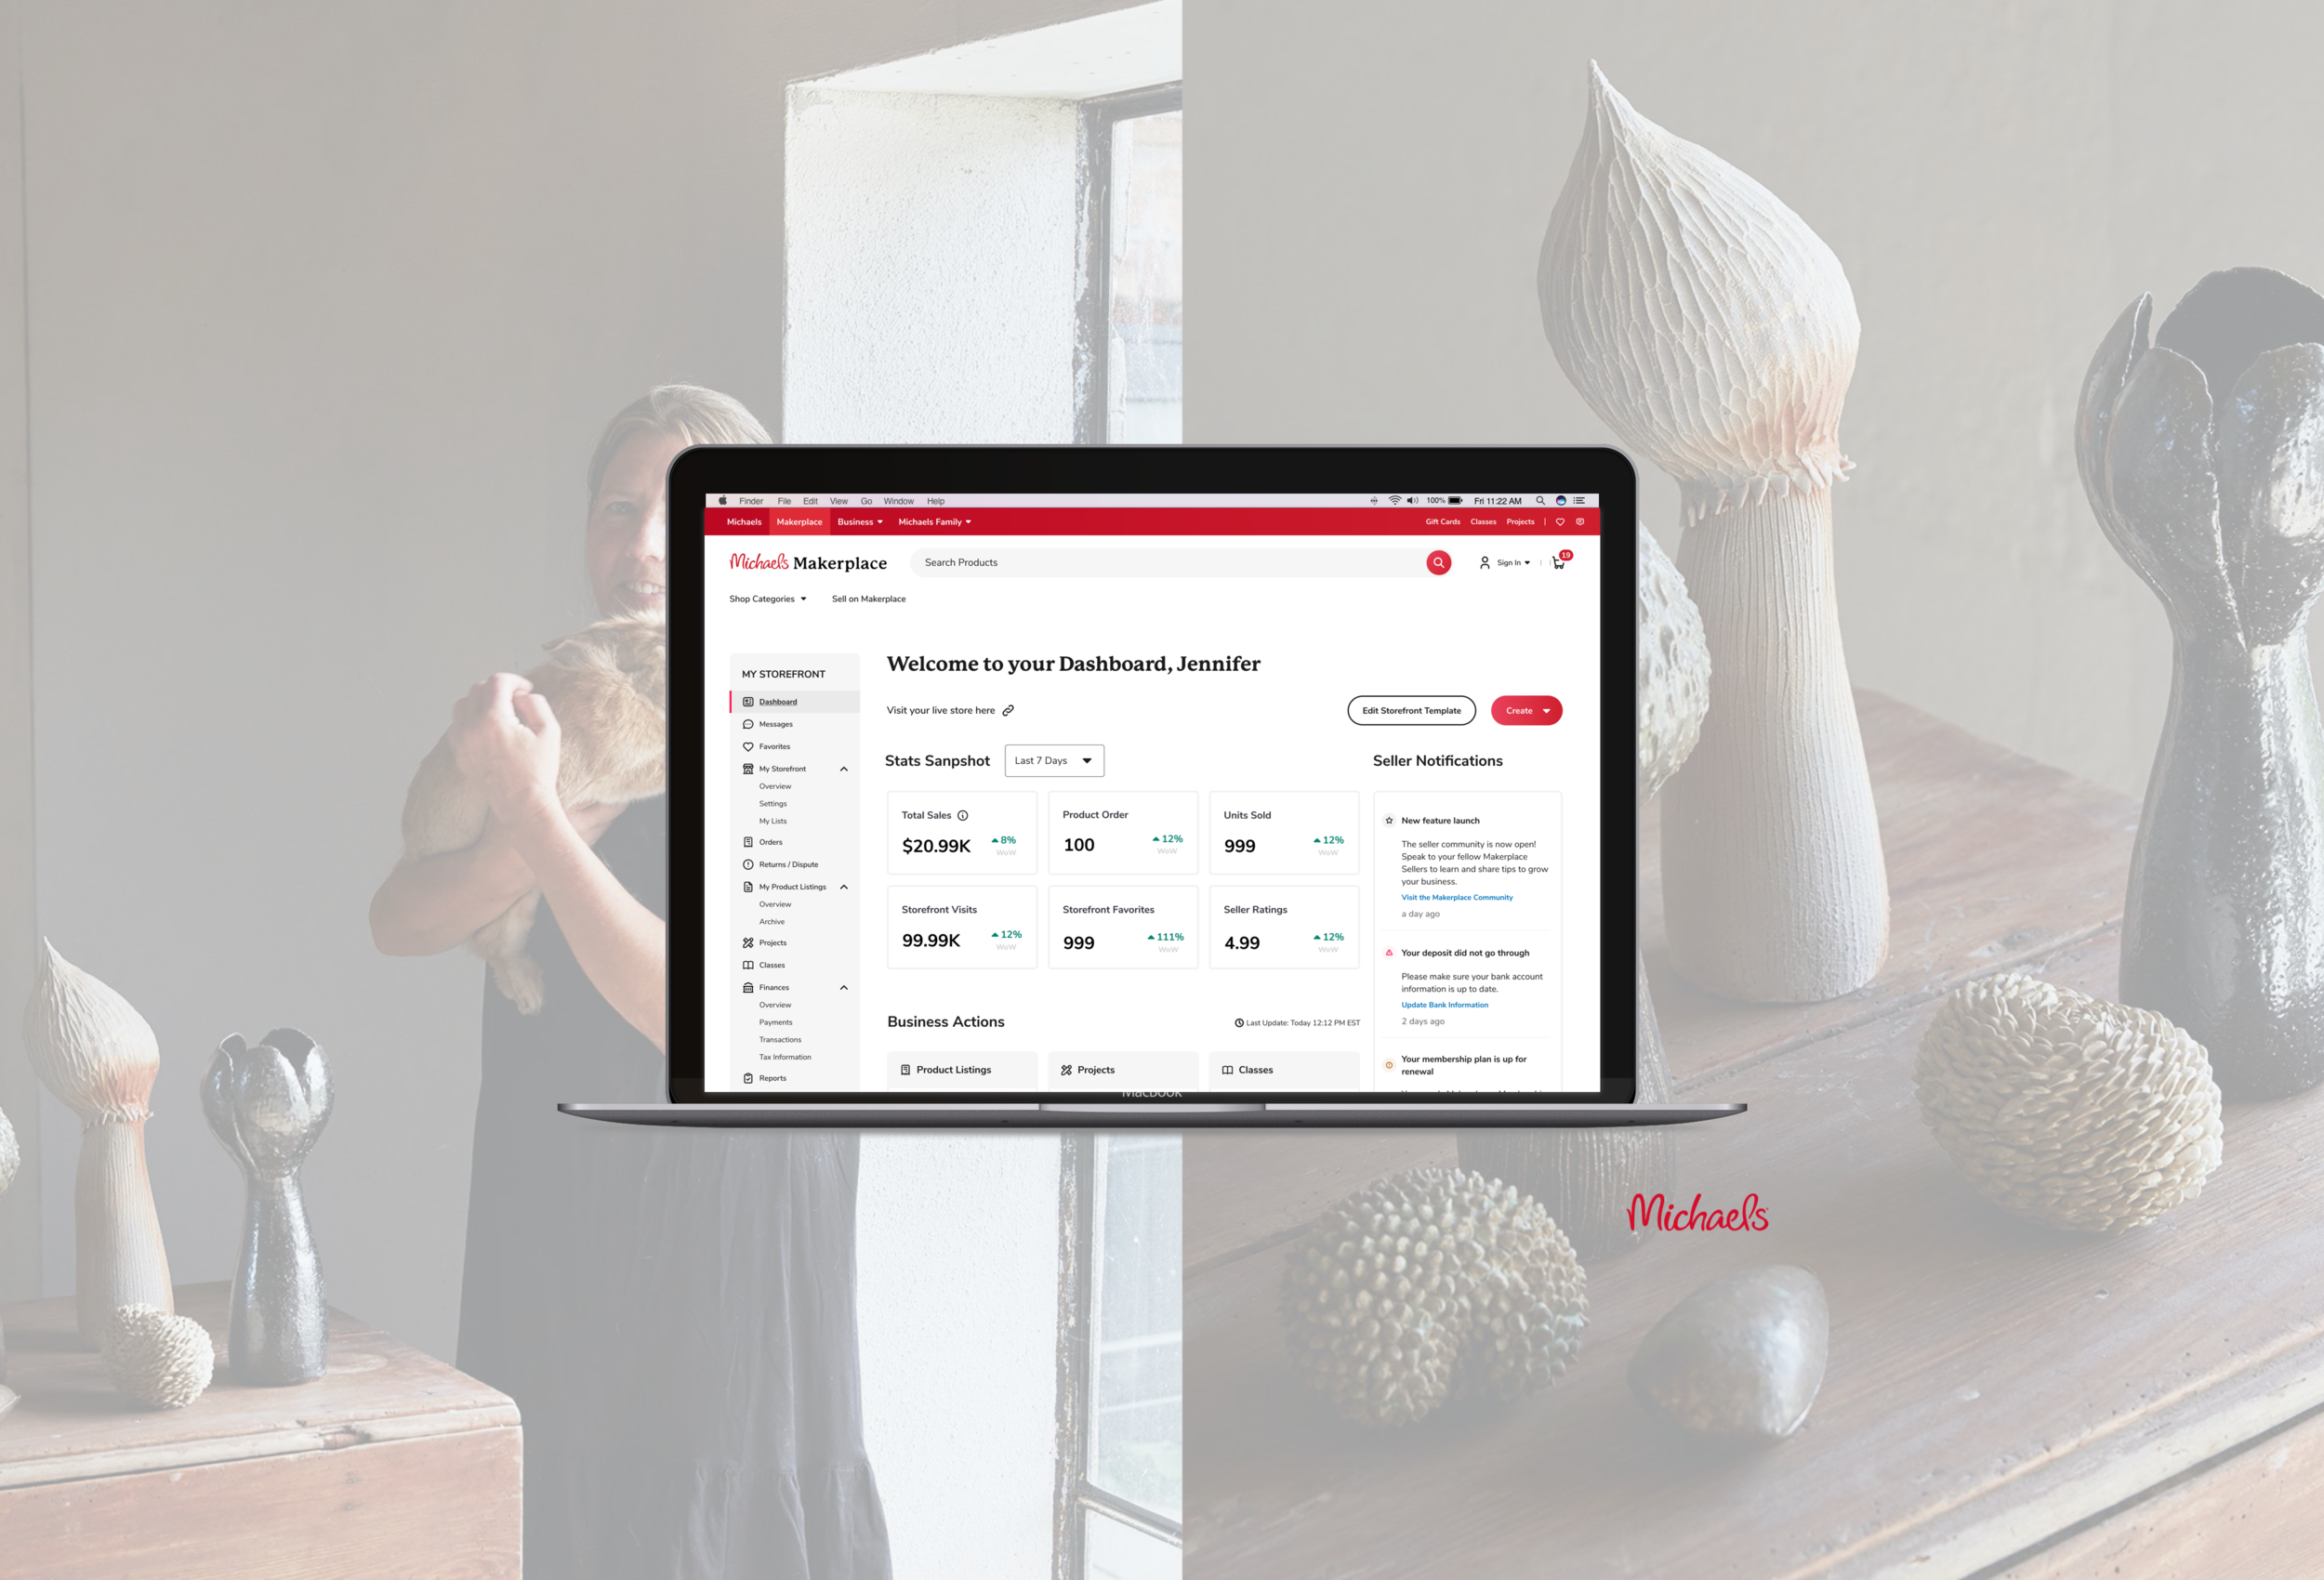
Michael’s Makerplace Dashboard: Leveling up to Star Makers
OVERVIEW
BRIEF
Creating Brand Loyalty through a Simple Data Visualization Language
Dashboard and reports is the new face of Michael’s Makerplace Seller Tool on michaels.com. Makers need powerful but easy to understand tools to stay on Makerplace.
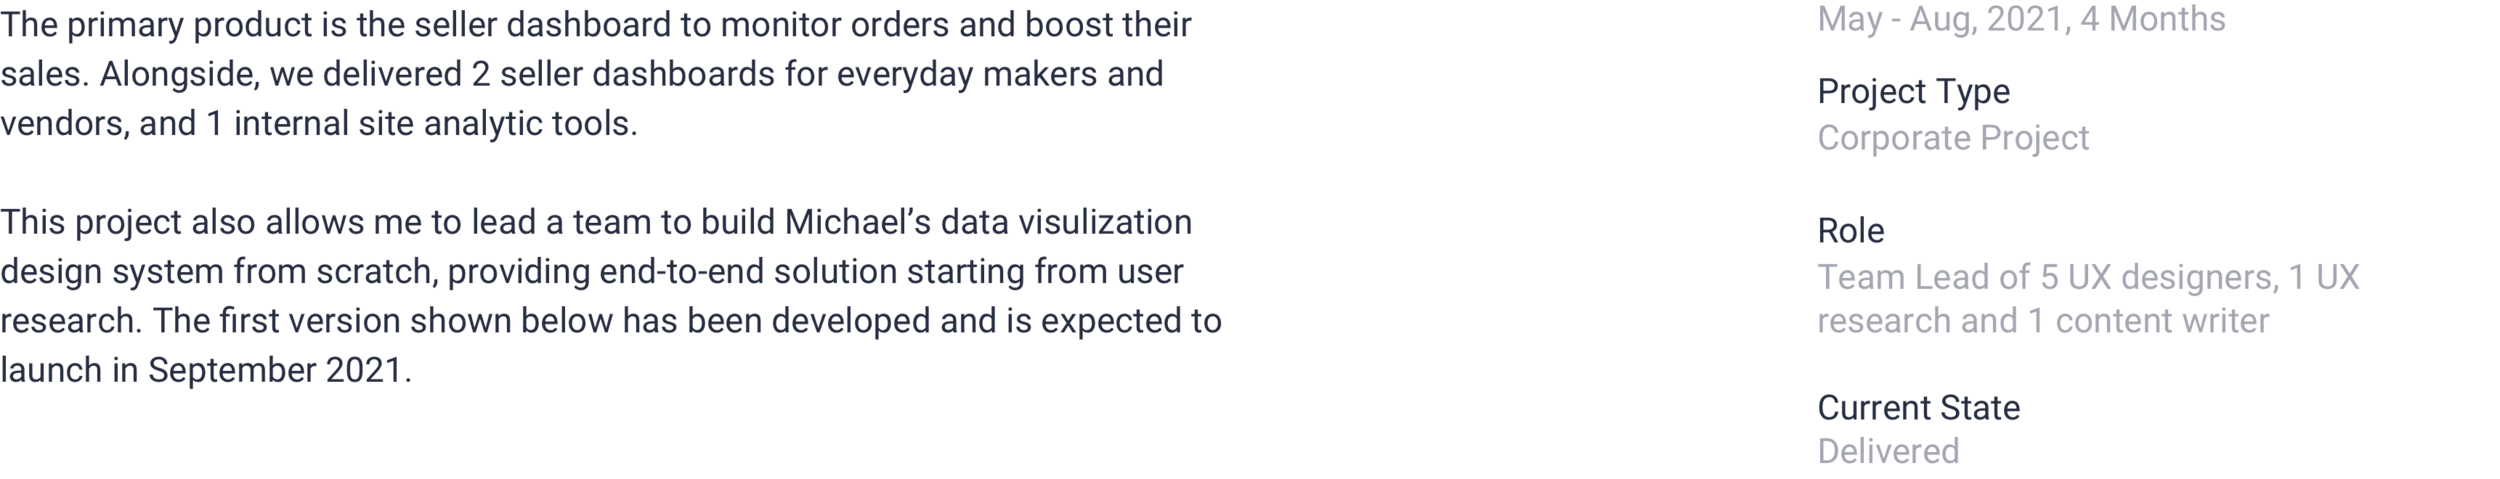
My Role
Team lead of 5 UX/UI designers, 1 researcher and 1 content writer
Introduced and documented all Data Visualization components in Design System
Collaborated with developers, QAing 2 dashboard pages
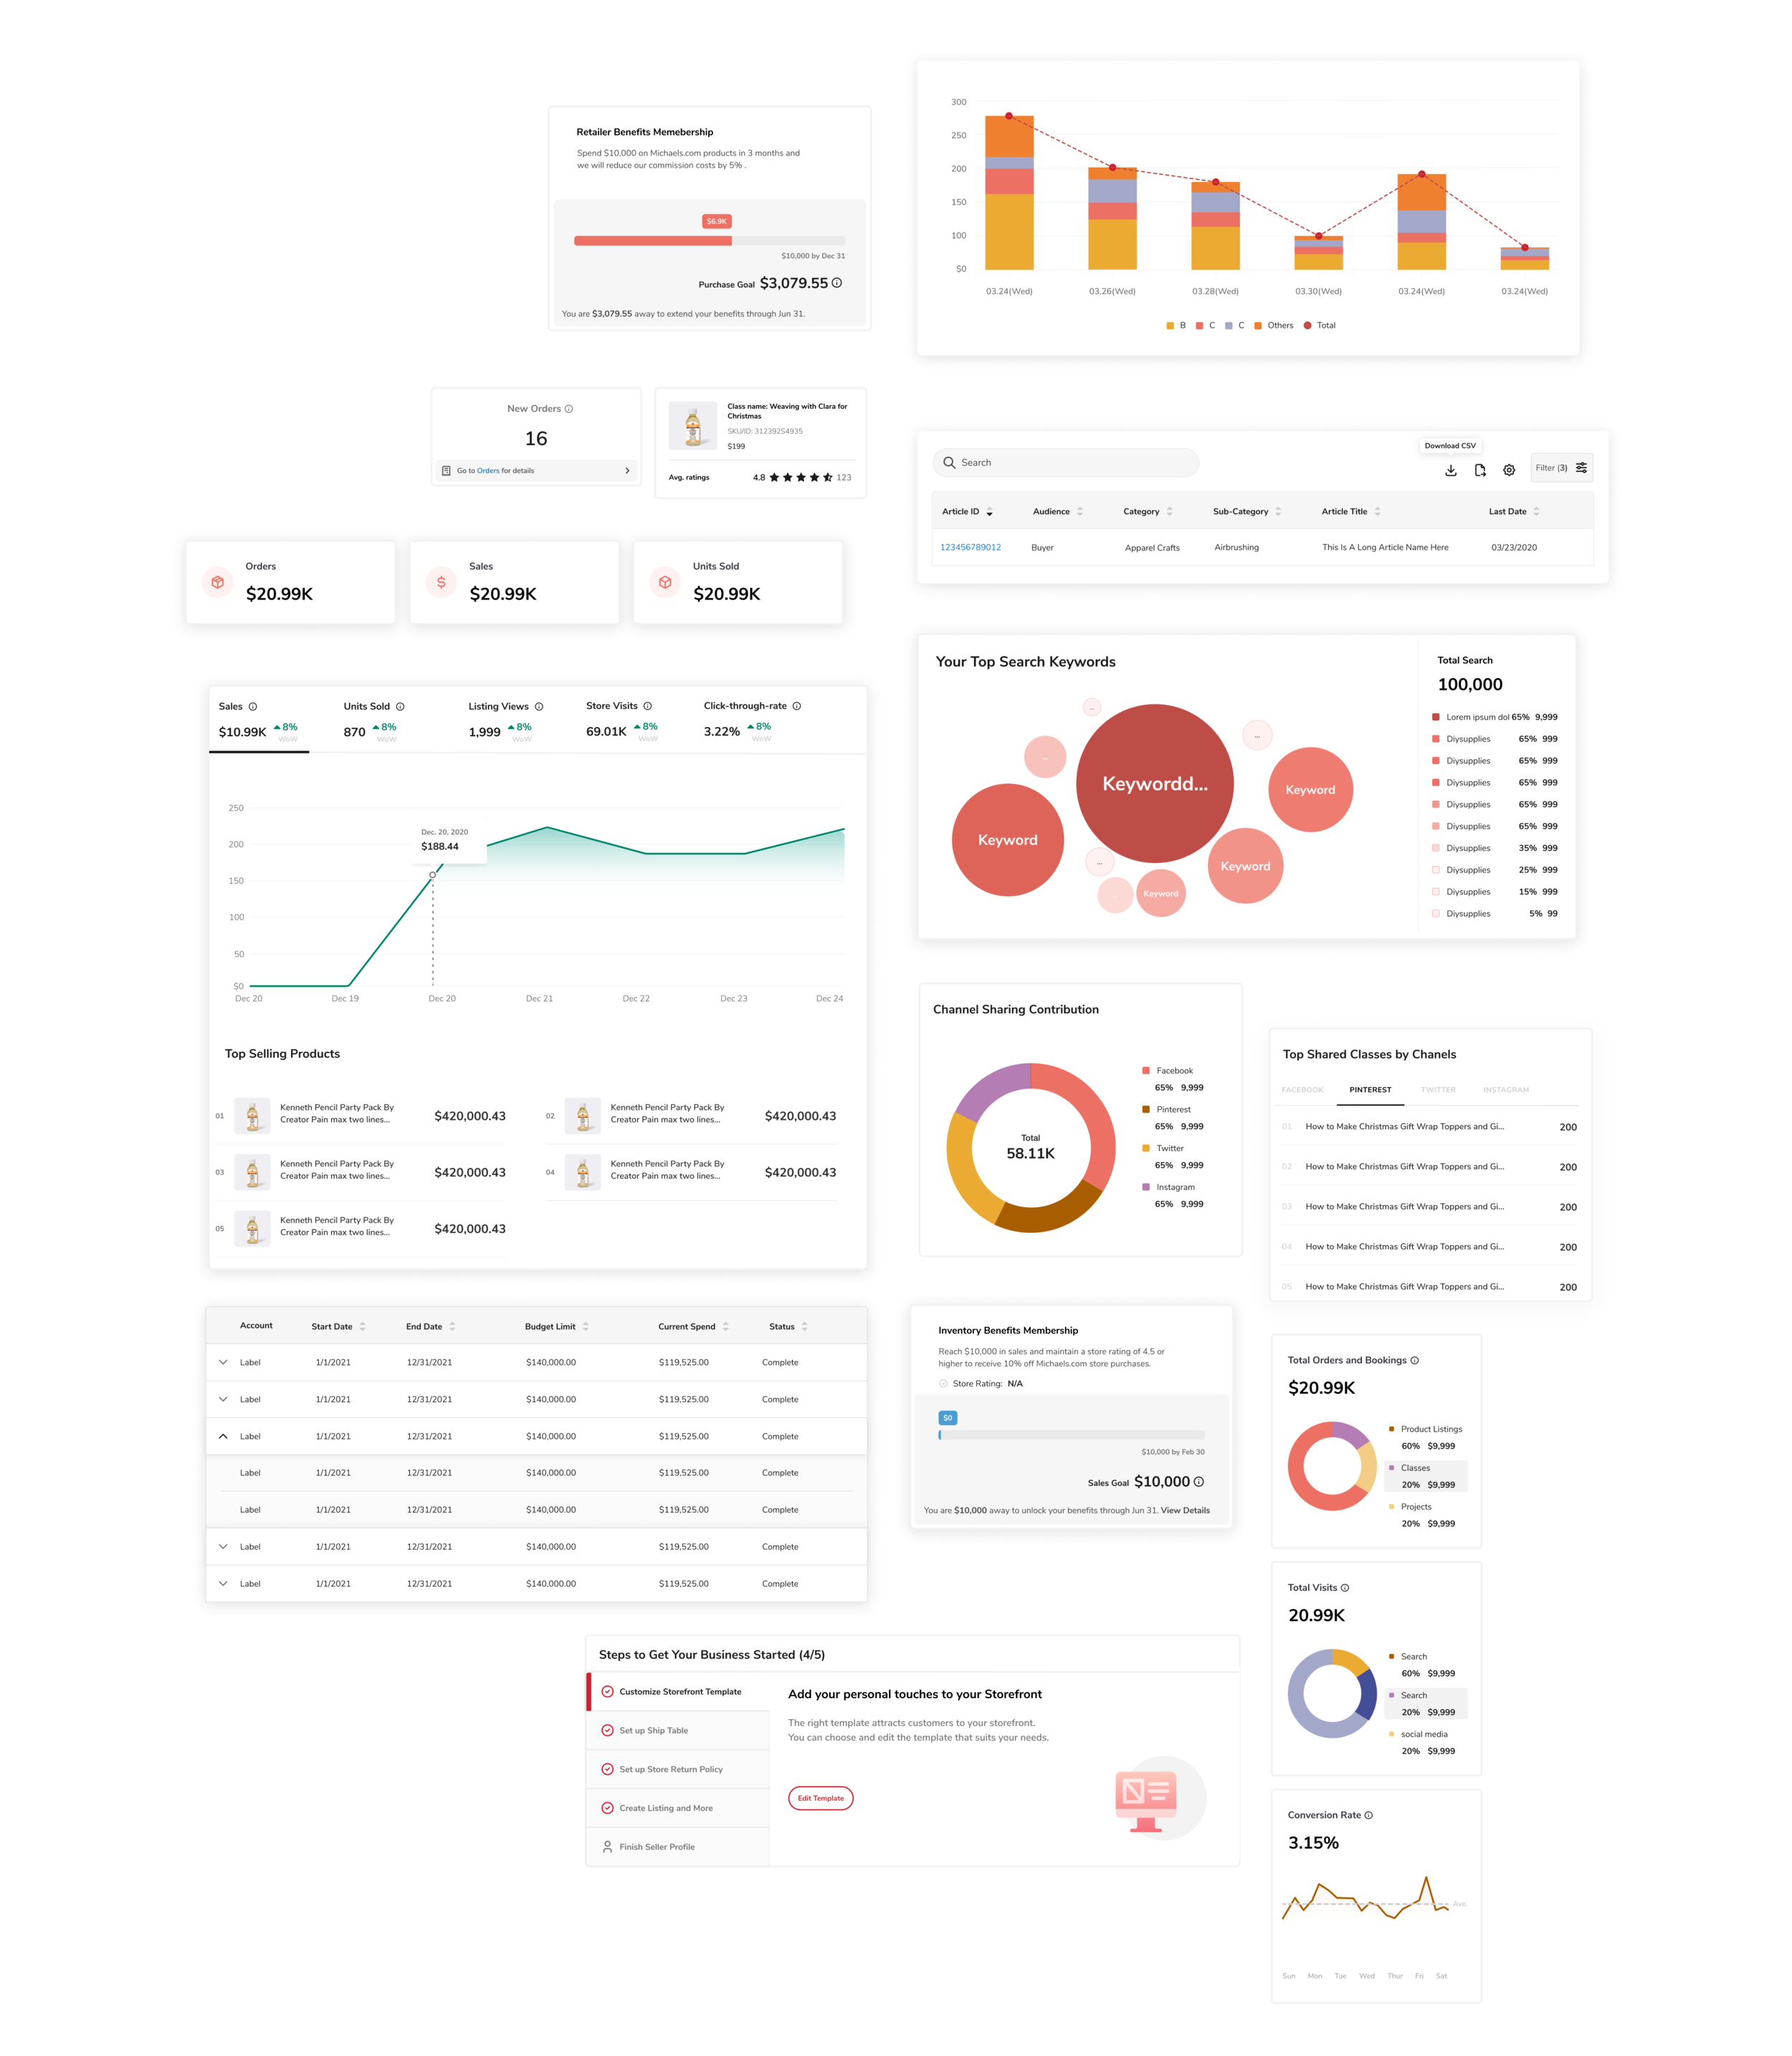
Components I Created from Scratch and Introduced to Design System
Design Process
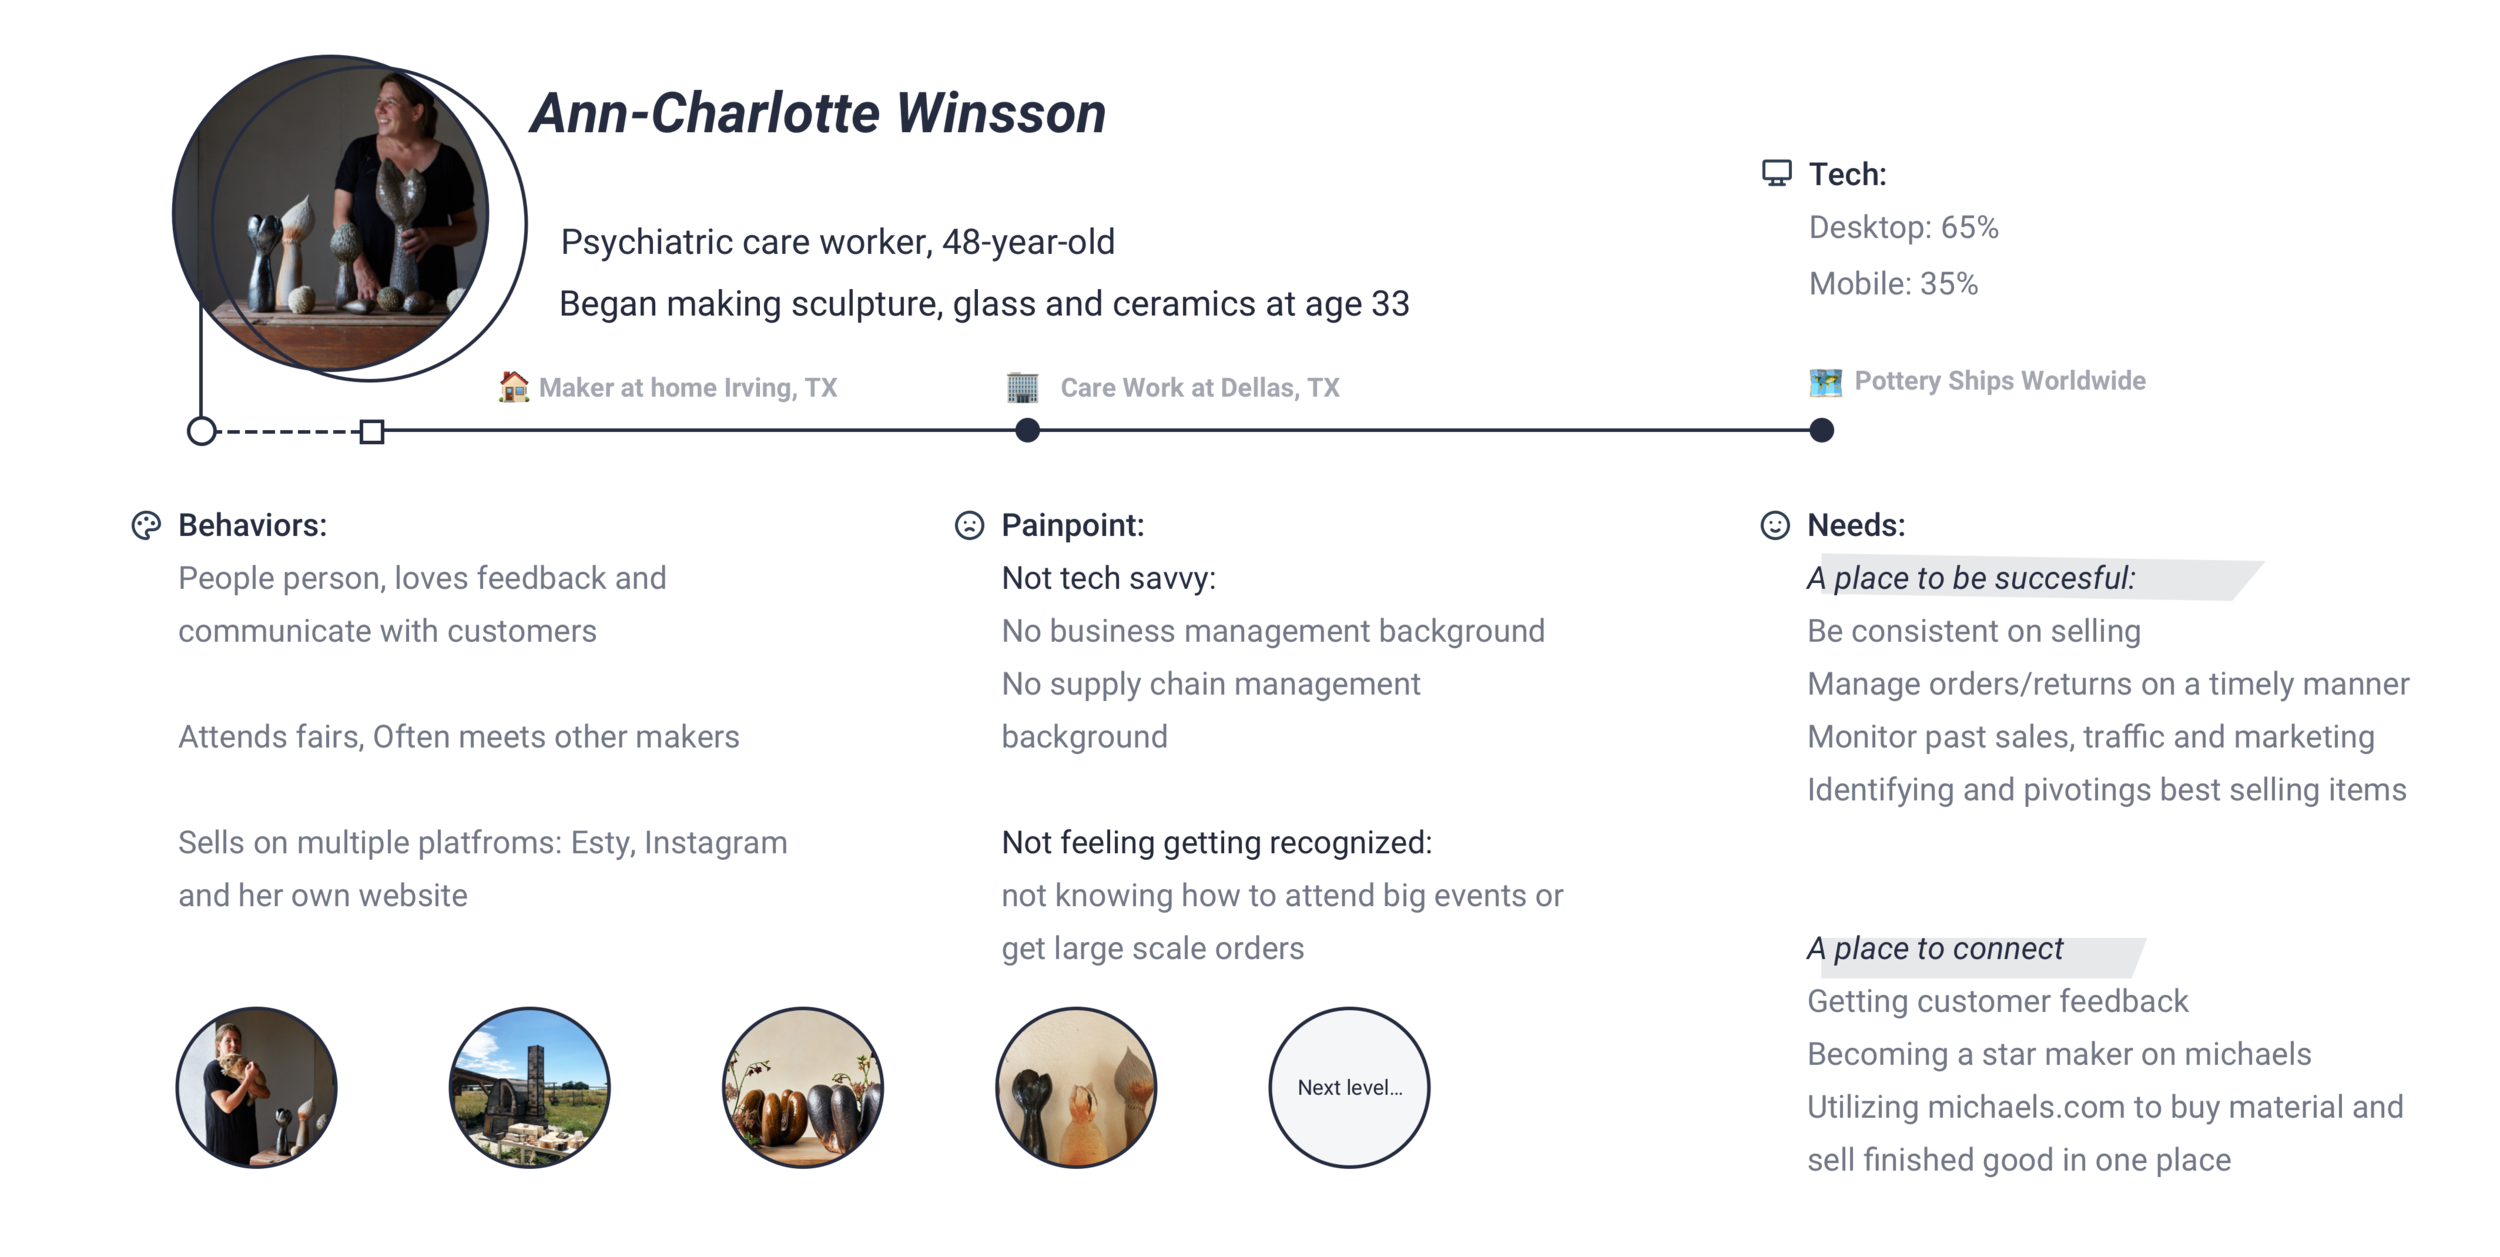
Persona Building
Empowering Makers Who Know Little about Running An Online Business
Collaborating with one UX researcher and Business team, we refined a maker persona based on the primary Michaels e-commerce persona. We revisited Ann-Charlotte several times through the iteration process and her limited business background played a crucial role when we made design decisions and pitched solutions during shareholder reviews.
ITERATION
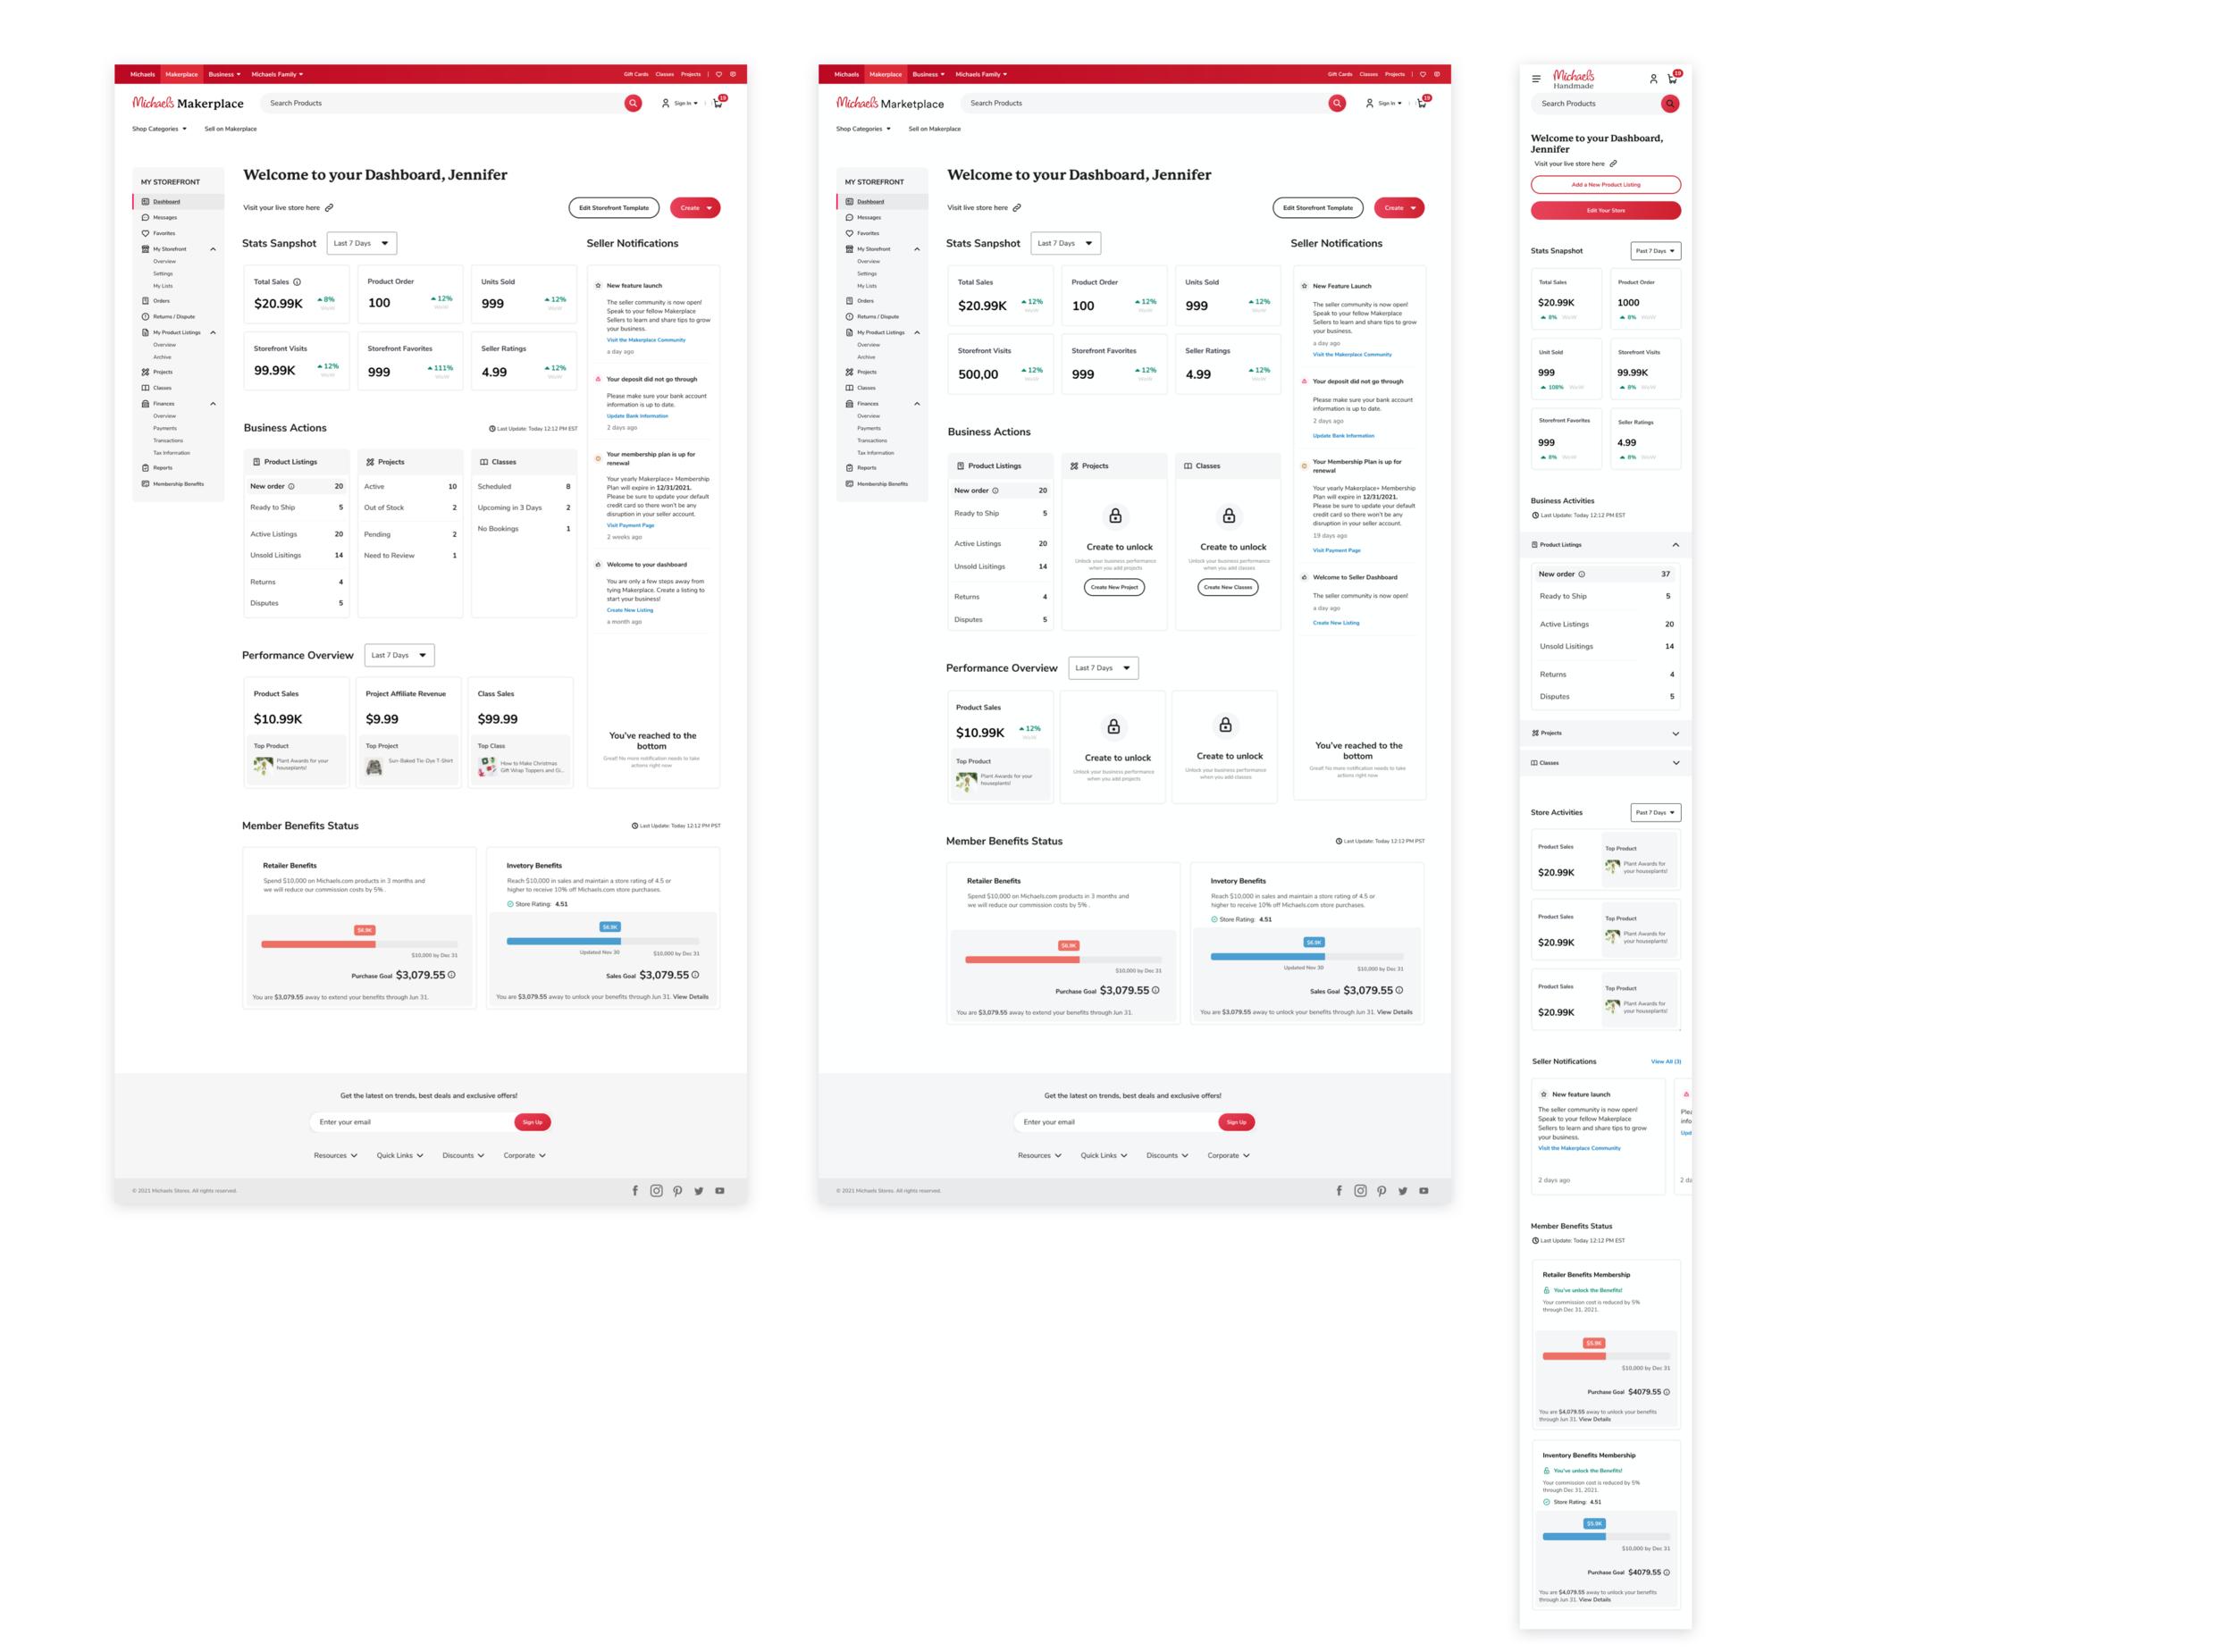
Seller Tool - Dashboard
ITERATION
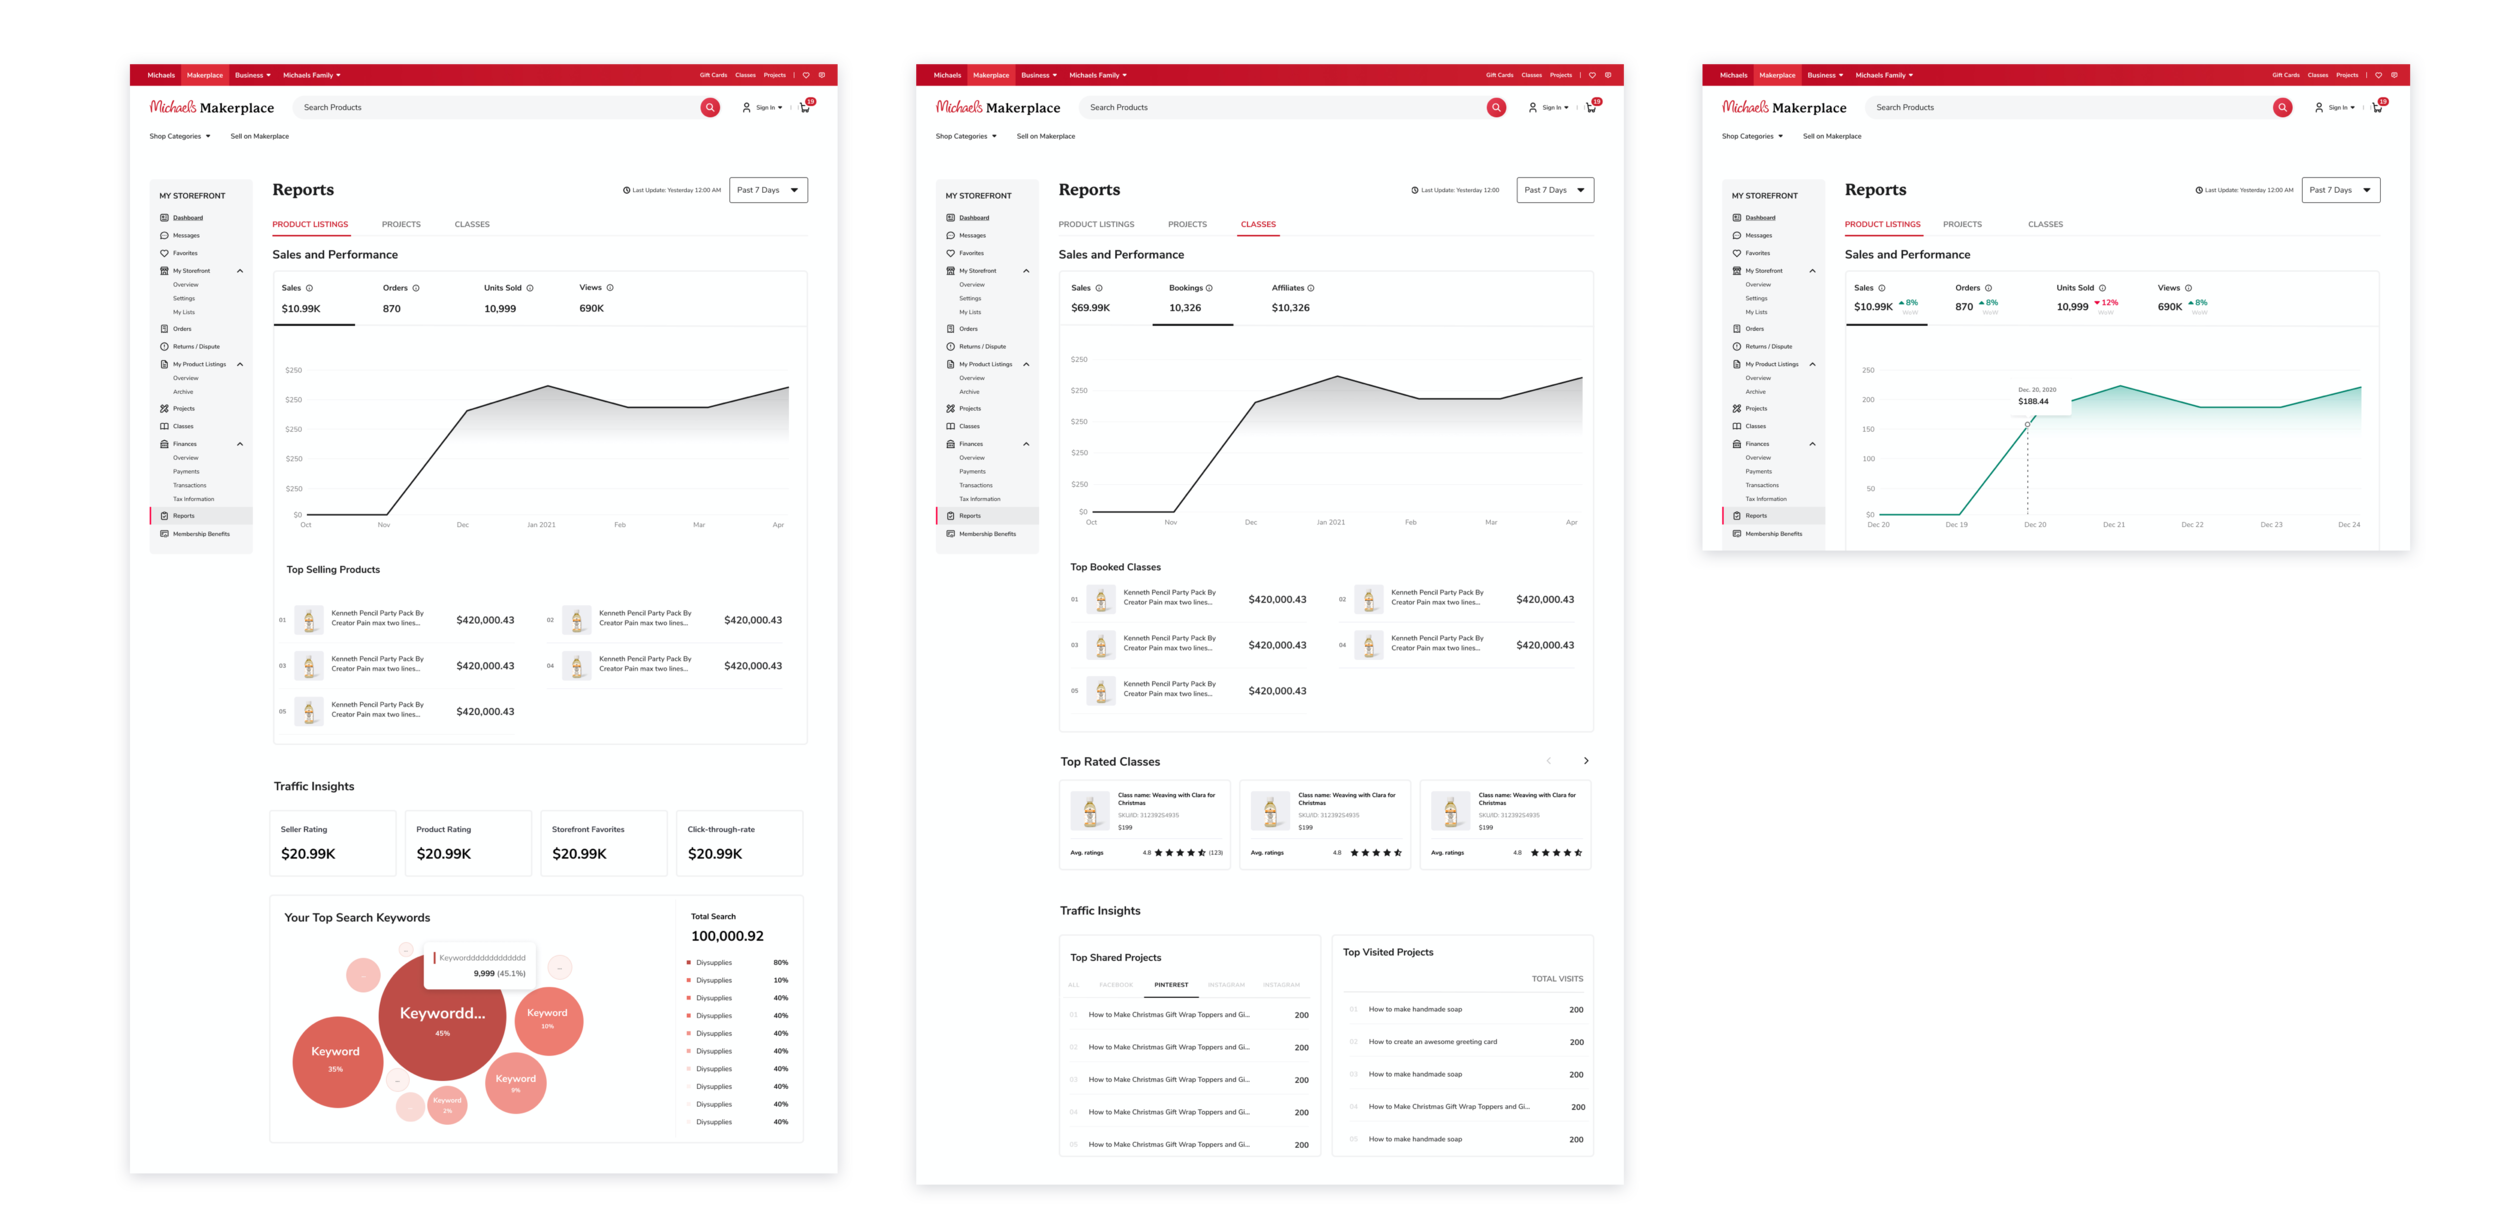
Seller Tool - Reports
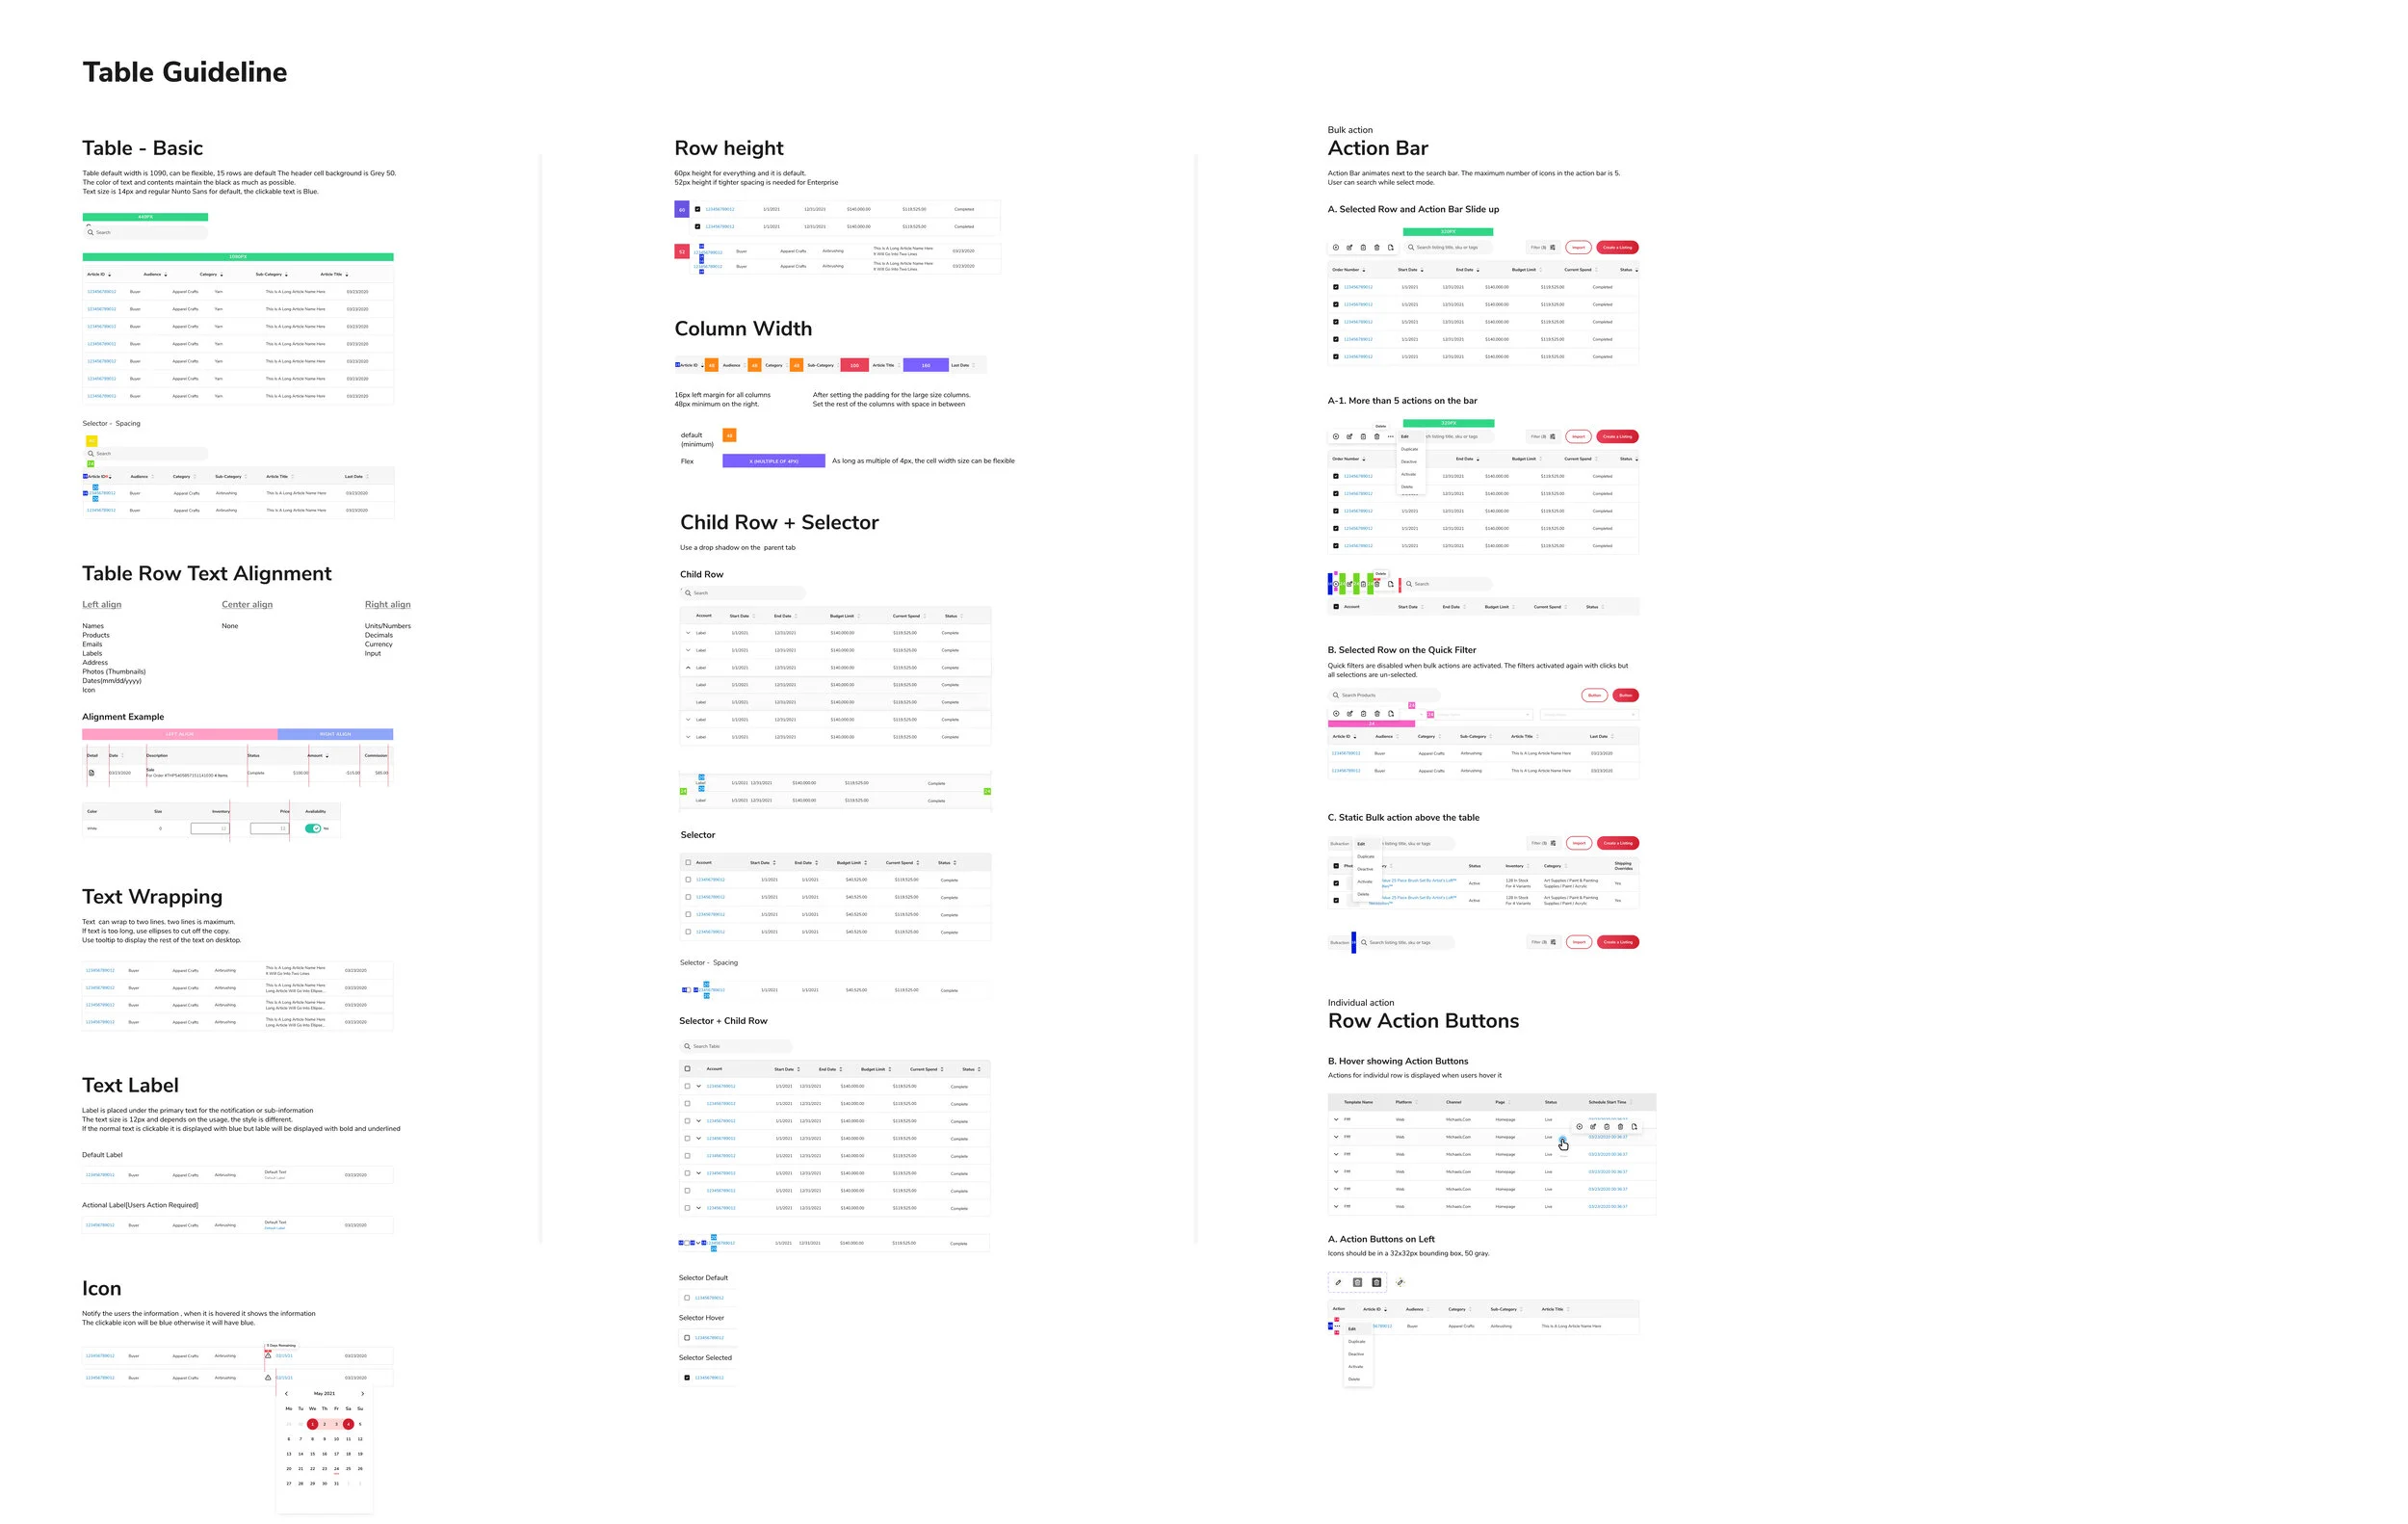
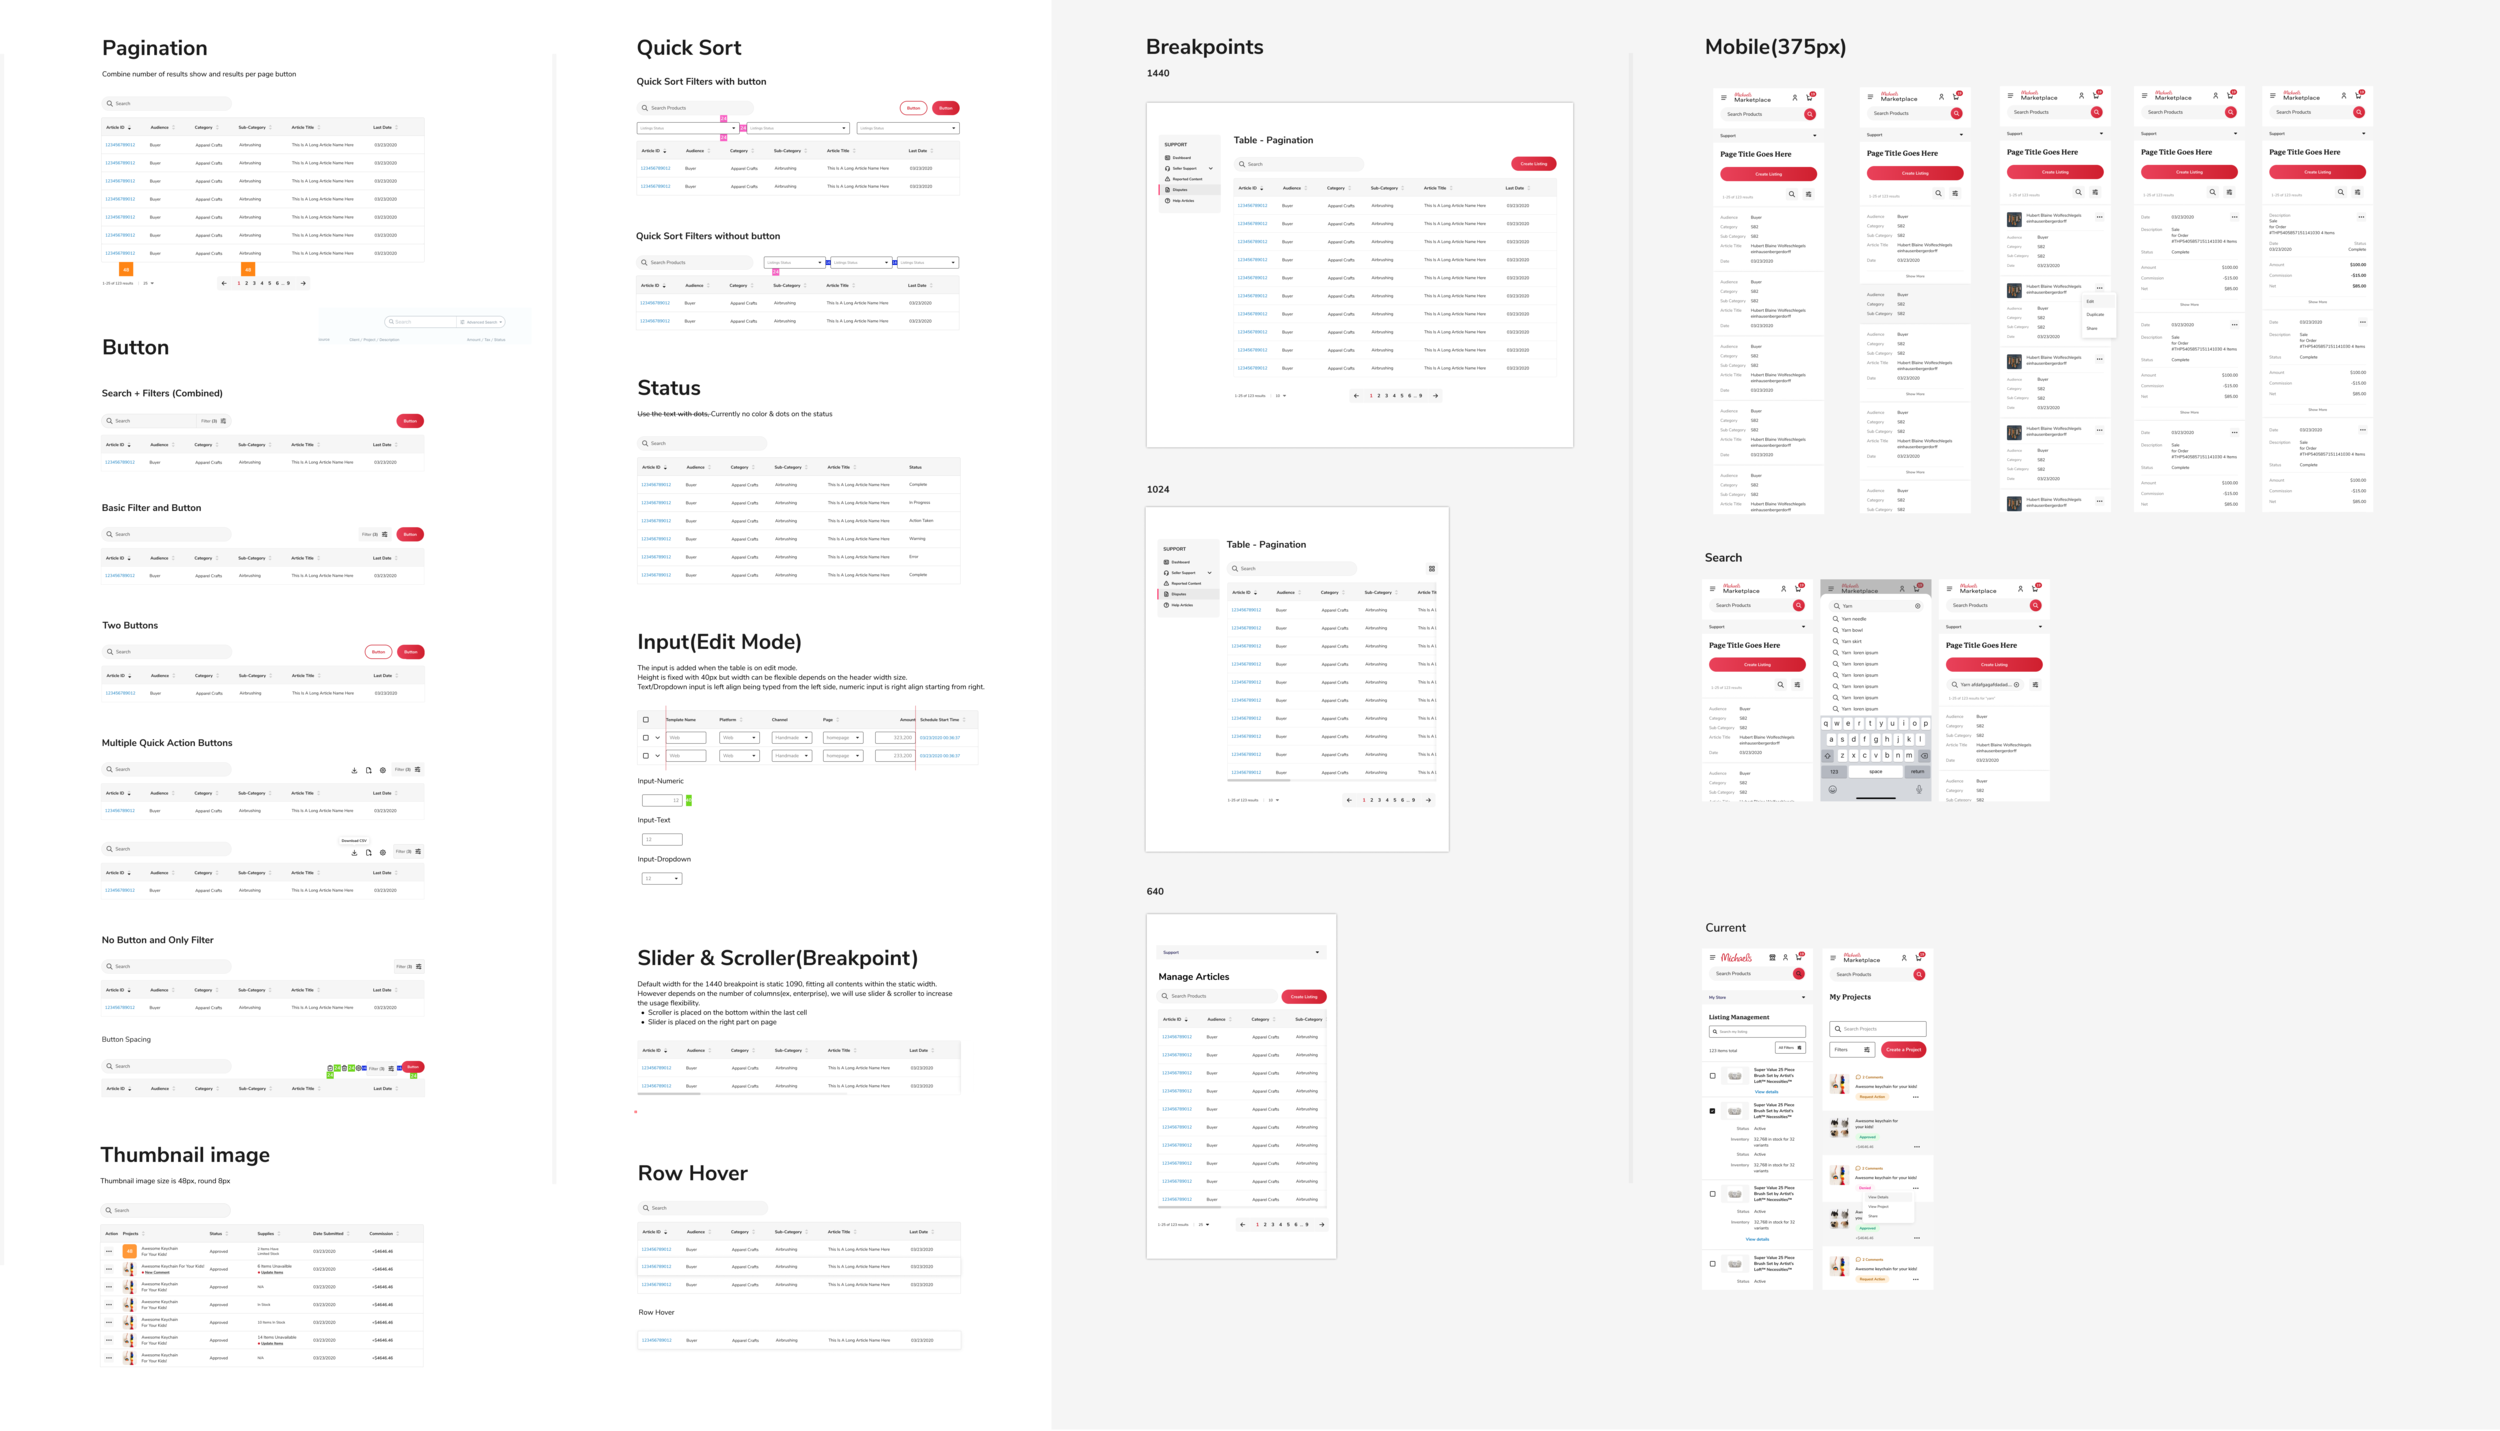
DOCUMENTATION
Keeping design system growing and consistent
Due to NDA, I’m unable to share the details of the projects. If you have more questions about my experience, just shoot me a message.